June 8th, 2015

It was a very shallow week for new releases with only one release that made any real impact. American Sniper dominated the combined home market chart selling ten times as many units as the second place film. During its first week of release, it sold 1.20 million units and generated $22.57 million in sales for an opening week Blu-ray share of 42%. The film is nearly in the top ten on the 2015 combined chart, but given its box office, it should have sold twice that. Also, its Blu-ray share is lower than expected for an action film.
More...
May 19th, 2015
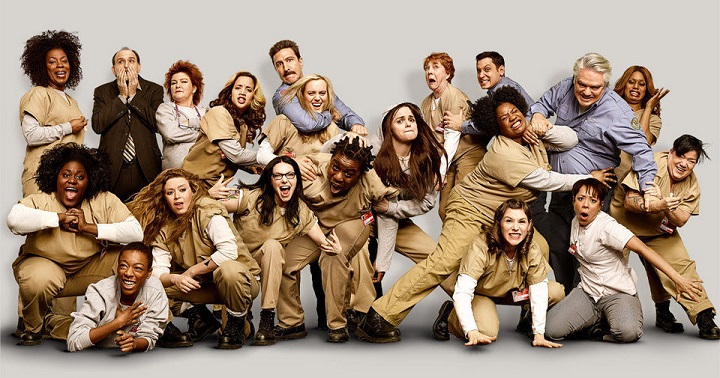
The home market is a lot stronger than it has been in weeks, but that is almost entirely due to the release of American Sniper on DVD and Blu-ray Combo Pack. On the other hand, it is not the best release on this week's list. There were many of contenders for Pick of the Week, including Girlhood and Limelight, but in the end I went with Orange Is the New Black: Season 2.
More...
March 3rd, 2015
As expected, Focus led the way at the box office, but sadly did so with a much lower opening weekend result than predicted. The rest of the top five were a little stronger than predicted each earning between $10 million and $12 million. That said, the overall box office was still weak, down 10% from last week to $107 million. It was also down 13% from last year. This caused 2015's lead over 2014 to drop. Granted, 2015 is still ahead of 2014 by $110 million or 6.8% at $1.74 billion to $1.63 billion, so it would take a while to lose that lead at this pace.
More...
February 25th, 2015
The winners of our Time and Time Again contest were determined and the entrants with the closest predictions for Hot Tub Time Machine 2 opening weekend were...
More...
February 24th, 2015
While there were three new releases to reach the top ten, the top three spots were held by holdovers. As expected, Fifty Shades of Grey won the box office race, but it did so with a much lower number. McFarland, USA was the strongest of the three new releases, while The DUFF earned the best per theater average. The less said about Hot Tub Time Machine 2's debut, the better. Overall, the box office fell 45% to $119 million compared to last weekend. At first glance, this is a disaster; however, this is a post holiday weekend and last week's number one film was artificially inflated at the box office due to hype and Valentine's Day. Compared to last year, the box office was 7% higher. This helped push 2015's lead over 2015 to 8.5% or $1.60 billion to $1.48 billion.
More...
February 22nd, 2015
A 73% second-weekend drop won’t be enough to keep Fifty Shades of Grey out of its top spot on the weekend box office chart, according to studio estimates released on Sunday. With another $23.25 million in the bank, the erotic drama has amassed $130 million after two weekends domestically, and has now taken over $400 million worldwide.
This relative weakness in Fifty Shades' second outing isn’t a big surprise given its fervent fanbase, who are more likely to attend on the first weekend, its mediocre reviews, and the fact that last weekend was a holiday, which can increase the box office take substantially. Perhaps more to the point, taking the top spot twice and reaching $400 million is enough. Universal already has every incentive to continue the franchise.
Second and third places this weekend go to two other returning films that are also set to fall more than 50% from last weekend’s totals: Kingsman: The Secret Service will post $17.5 million for $67 million after two weekends, and The SpongeBob Movie: Sponge Out of Water adds $15.5 million to take its tally to $125 million after three. While it is a substantial decrease, this is a more typical second-weekend drop.
More...
February 20th, 2015
Fifty Shades of Grey will again win the weekend box office race. In fact, it could make more than the three new wide releases make combined. The biggest of these three wide releases is Hot Tub Time Machine 2, but it is unfortunately earning terrible reviews. The DUFF's reviews were amazing, but it has since settled on merely good. McFarland, USA is earning the best reviews, but unfortunately its buzz is really quiet. Granted, its target audience doesn't tend to get hyped about movies, but this still isn't a good sign. This weekend last year, The LEGO Movie remained in first place with just over $30 million. This is about the same as Fifty Shades is expected to earn. If 2015 is to win, it will need to rely on depth. Since we could have seven films earning $10 million or more, that won't be an issue.
More...
February 13th, 2015
Next weekend, there are three wide releases, none of which are expected to do well. Hot Tub Time Machine 2 is opening wider than McFarland, USA and has louder buzz, but McFarland is going after a more mature target audience, so it is harder to gauge the buzz online. (The DUFF won't even be a factor in this race.) I think Hot Tub Time Machine 2 has a slight lead over McFarland, USA and as such, it is the target film in this week's box office prediction contest. In order to win, one must simply predict the opening weekend box office number for Hot Tub Time Machine 2.
Whoever comes the closest to predicting the film's opening 3-day weekend box office (Friday to Sunday), without going over, will win a Frankenprize, featuring Big Bad Wolves on DVD, among other prizes.
Whoever comes the closest to predicting the film's opening 3-day weekend box office (Friday to Sunday), without going under, will also win a Frankenprize, also featuring Big Bad Wolves on DVD, among other prizes.
Entries must be received by 10 a.m., Pacific Time on Friday to be eligible, so don't delay!
More...
February 1st, 2015
It was a record-breaking January thanks entirely to American Sniper, which set records, both during its limited release run and especially when it expanded wide. There were a couple of other films that did well, but for the most part, it was a typical January. The question is, will American Sniper boost the overall box office, which would help February, or will its effects fade as it does? There are ten wide releases in February; there are a few films that may or may not open in the top ten. Of these, there are only two that have a real shot at true box office success. The biggest film in terms of buzz is Fifty Shades of Grey, which looks so, so bad. Personally, I would rather watch The SpongeBob Movie: Sponge Out of Water a hundred times than sit through just the trailer for Fifty Shades of Grey. If Fifty Shades of Grey becomes the biggest hit of the month, it will mrean the end of civilization. Because. I. Will. End. Civilization. Last February was mostly mediocre, except for The LEGO Movie which was a huge early year hit. There's no chance any film opening this month will match The LEGO Movie; the top two films likely won't match The LEGO Movie. Because of this, 2015 will need to rely on depth to come out ahead. I'm not sure how likely that will be.
More...

-Thumbnail.jpg)